

Neighborhood insights
We built a neighbourhood exploration tool for home-searchers to support them in finding the neighborhood that fits their needs & wishes.
Neighborhood insights
We built a neighbourhood exploration tool for home-searchers to support them in finding the neighborhood that fits their needs & wishes.
Neighborhood insights
We built a neighbourhood exploration tool for home-searchers to support them in finding the neighborhood that fits their needs & wishes.
Initially, the project started as an explorative research, driven by 1 UX (👋) & 1 PO, later on supported with a full development team.
Funda is the biggest real estate marketplace in the Netherlands. Through this market leadership, Funda has a lot of insight into the housing market in general.
Funda wanted to expand beyond just being the platform that connects home searchers with real estate agents. We wanted to relief stress in the phase after contacting an agent, but we first had to find the most valuable problems to solve for home-searchers.
Process
Discovery-first approach
Instead of planning a big project, with a full roadmap of features, ideas and iterations, we proposed an alternative approach, which we called discovery-first development. Its core principle was to discover first, validate second and then when we as a team were confident, scale up to full development of the feature.
We pitched it to stakeholders using the following key principles:
Always Be Learning
Stay away from gut-feeling choices and validate your assumptions.
User-centric
Start with understanding your users through and through, using mixed research methods.
As lean as possible
Minimize risk early in the process, by focusing on learning fast with minimal development costs.
Research
Discovery-first approach
After analyzing the customer journey, we decided to dive deep into the viewing and bidding phase, using a variety of research methods, ranging from customer interviews to quantitative surveys about pain points up to data analysis of anonymized object notes.
Research methods
phone interviews
in-person interviews
surveys
competitor
research
notes
tagging
user data analysis
Problem
After summarizing the research, we identified several clear pain points as valuable opportunities for funda. The following problems were eventually identified as the most valuable problems to solve for our users:
Experiments
Request sale price
Through the explorative research, we discovered that home-searchers look at sold homes as a foundation for their bids, but are lacking the access to the actual sale price of a home.
To validate the demand, we ran a simple experiment in which we added a link (”Want to know the selling price?”) on the sold homes on our platform. Clicking this link opened a dialog with instructions on how to get access to the sale price of that home.

The experiment consisted of just a simple dialog with a clickthrough to an external service.
Market data products
To get some more insight into which kind of data is most valuable to home-searchers, we ran a so-called ‘fake door’ experiment. In this experiment, we offered multiple data points as a product, to measure the relative value of these insights into the market.
By presenting these data-points as separate products, we found out that there’s a real interest into insights into market insights in a specific area, as well as being able to see how popular a specific object is.

The experiment represented a simplified checkout in which you could 'buy' market data.
Experiments
Request sale price
Through the explorative research, we discovered that home-searchers look at sold homes as a foundation for their bids, but are lacking the access to the actual sale price of a home.
To validate the demand, we ran a simple experiment in which we added a link (”Want to know the selling price?”) on the sold homes on our platform. Clicking this link opened a dialog with instructions on how to get access to the sale price of that home.
The experiment consisted of just a simple dialog with a clickthrough to an external service.
Market data products
To get some more insight into which kind of data is most valuable to home-searchers, we ran a so-called ‘fake door’ experiment. In this experiment, we offered multiple data points as a product, to measure the relative value of these insights into the market.
By presenting these data-points as separate products, we found out that there’s a real interest into insights into market insights in a specific area, as well as being able to see how popular a specific object is.
The experiment represented a simplified checkout in which you could 'buy' market data.
Small wins
Price per square meter
During our experiments, we learned that some home-searchers currently calculate the price per square meter of a home, by just dividing the asking price of a home by the living size.
Instead of letting our users do the calculations, we did it for them and added it to the key features of a home.

The price per square meter was added prominently in the list of features.
Activity metrics
During the experiment with market data products, we learned about the demand for getting insights into the popularity of a home. In a company hackathon, we decided to get this feature live.
As all activity happens on our own platform, we were able to quickly ship the feature with activity metrics for number of views and saves for every house on Funda.
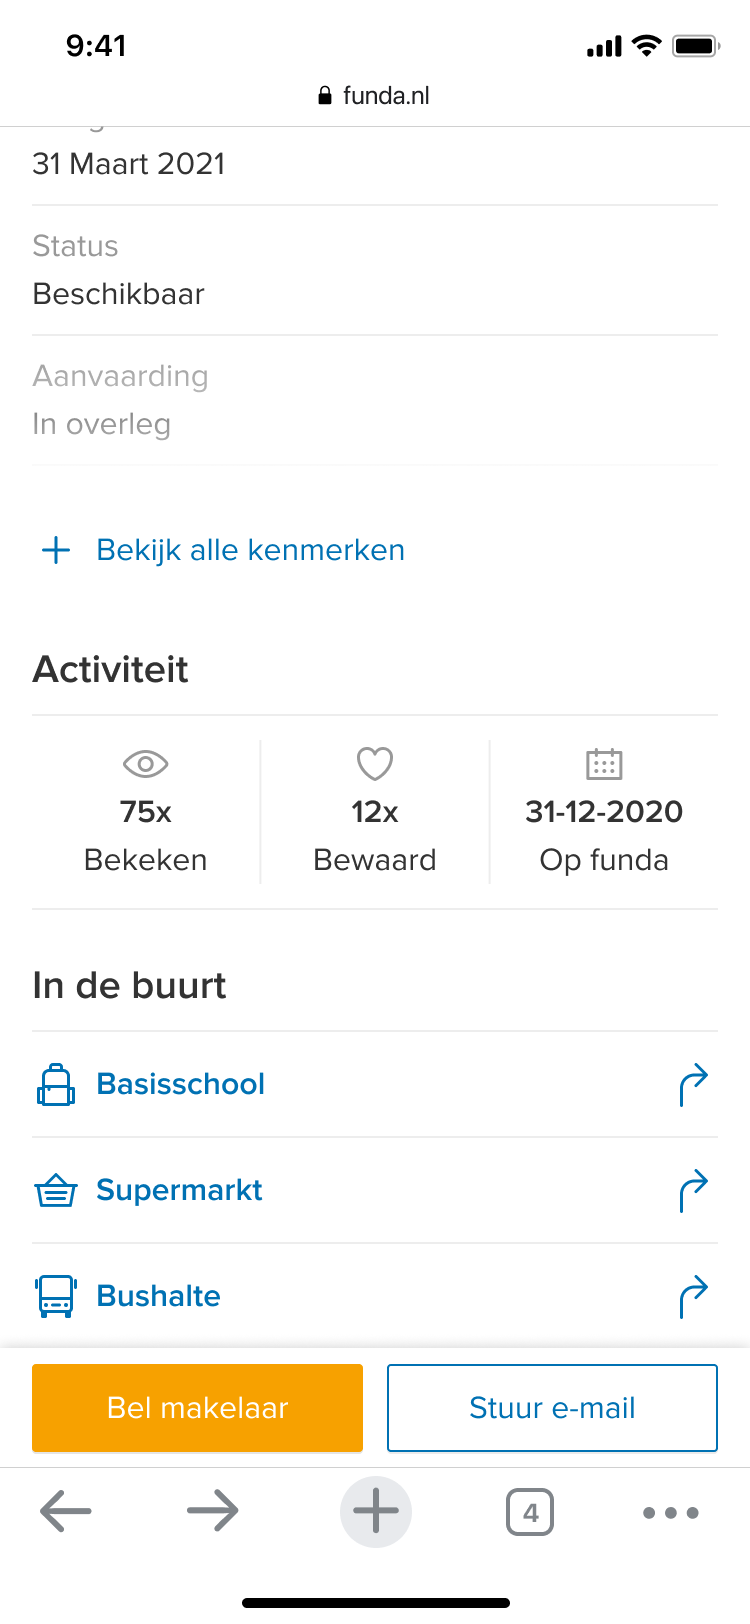
Activity metrics are shown for every home on Funda to provide insights into its relative popularity.
Small wins
Price per square meter
During our experiments, we learned that some home-searchers currently calculate the price per square meter of a home, by just dividing the asking price of a home by the living size.
Instead of letting our users do the calculations, we did it for them and added it to the key features of a home.
The price per square meter was added prominently in the list of features.
Activity metrics
During the experiment with market data products, we learned about the demand for getting insights into the popularity of a home. In a company hackathon, we decided to get this feature live.
As all activity happens on our own platform, we were able to quickly ship the feature with activity metrics for number of views and saves for every house on Funda.
Activity metrics are shown for every home on Funda to provide insights into its relative popularity.
Ideation
Creative workshop
I organized a 1-day creative workshop for our development team, based on the outline of the Design Sprint, to generate some ideas, but also to include all team members in the design process.
One of the concepts described a service for home-searchers in which they could get insights into the market data for a specific location. These insights ranged from insights into the housing market, with average sales prices and time to sell, up to demographics.
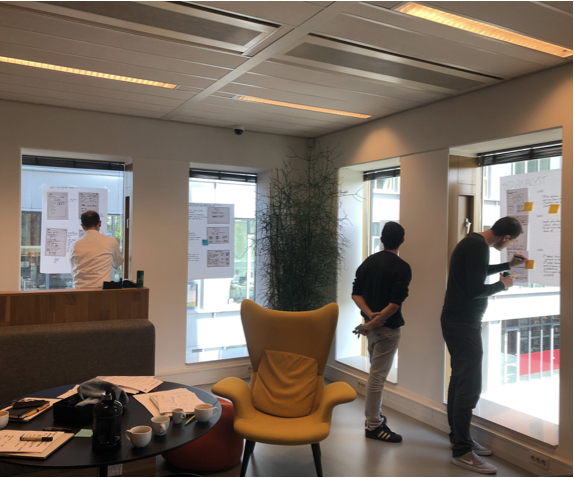
The full-day workshop ended with presenting and pitching the individual concepts.
Prototyping
To validate if this concept was a solution for home-searchers, we created a prototype using real market data, hacked together in Google Data Studio. This is not a design tool obviously, but we managed to make the prototype look like an actual service from Funda and with the power of Data Studio, it was possible to make it completely customizable for every location.
The prototype was used for customer interviews at a fair which is visited often by prospective and recent home buyers. In these interviews we learned a lot about which insights home searchers really valued, but also learned that this direction was clearly too complex and overwhelming for our target group.

The prototype was built in Google Data Studio, but styled like it was integrated in the Funda website.
Ideation
Creative workshop
I organized a 1-day creative workshop for our development team, based on the outline of the Design Sprint, to generate some ideas, but also to include all team members in the design process.
One of the concepts described a service for home-searchers in which they could get insights into the market data for a specific location. These insights ranged from insights into the housing market, with average sales prices and time to sell, up to demographics.
The full-day workshop ended with presenting and pitching the individual concepts.
Prototyping
To validate if this concept was a solution for home-searchers, we created a prototype using real market data, hacked together in Google Data Studio. This is not a design tool obviously, but we managed to make the prototype look like an actual service from Funda and with the power of Data Studio, it was possible to make it completely customizable for every location.
The prototype was used for customer interviews at a fair which is visited often by prospective and recent home buyers. In these interviews we learned a lot about which insights home searchers really valued, but also learned that this direction was clearly too complex and overwhelming for our target group.
The prototype was built in Google Data Studio, but styled like it was integrated in the Funda website.
Solution
Neighborhood insights
We made the decision to add focus to the feature and simplify the amount and complexity of the data we would show to home-searchers. Through some iterations we reached the current product, which was named ‘neighborhood insights’.


The layout of the neighborhood insights
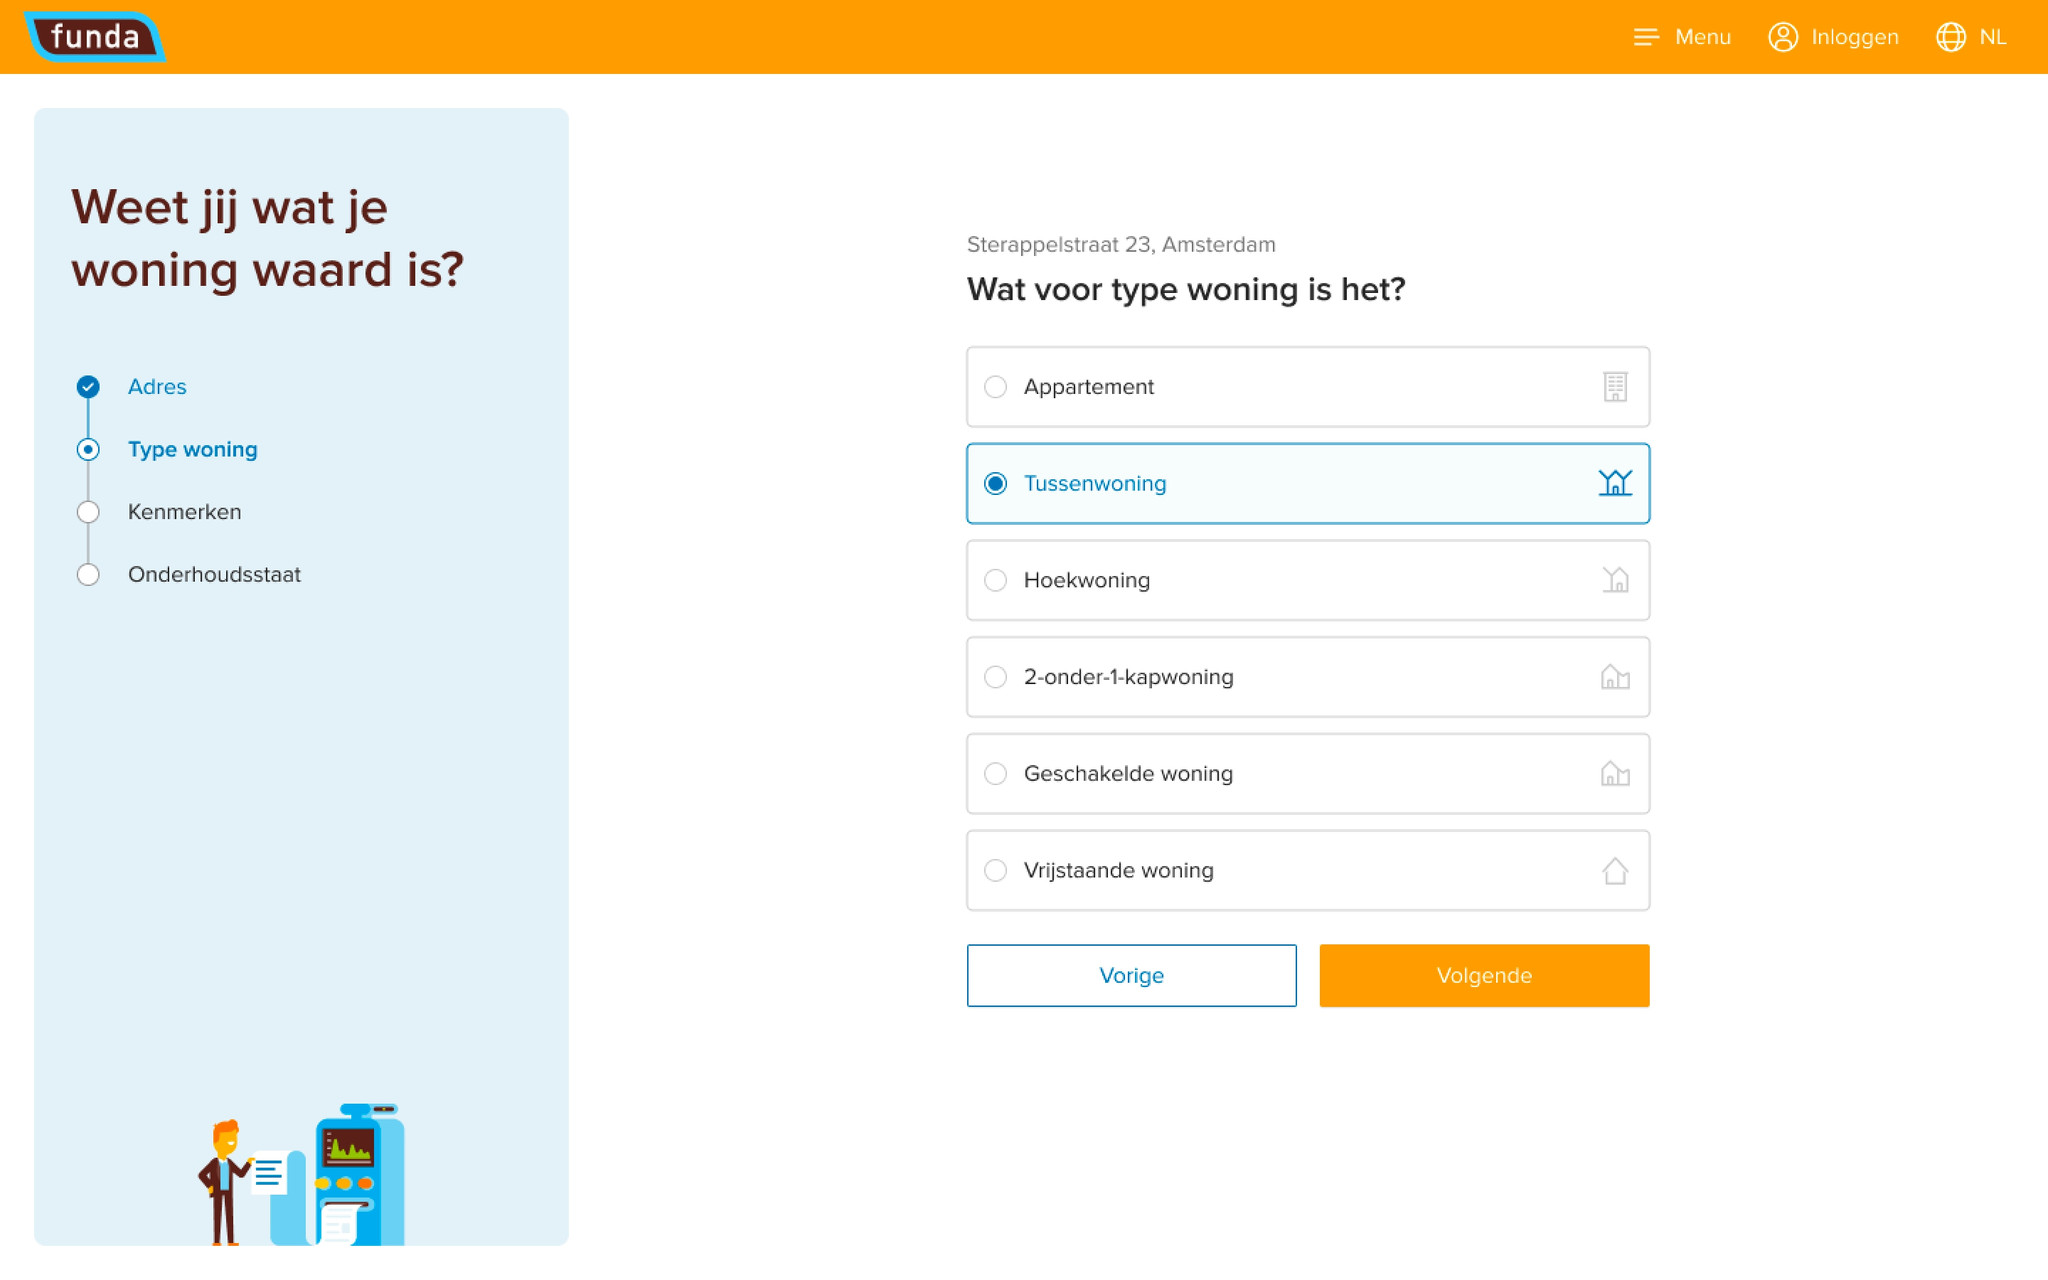
Mockups of the feature at rollout →
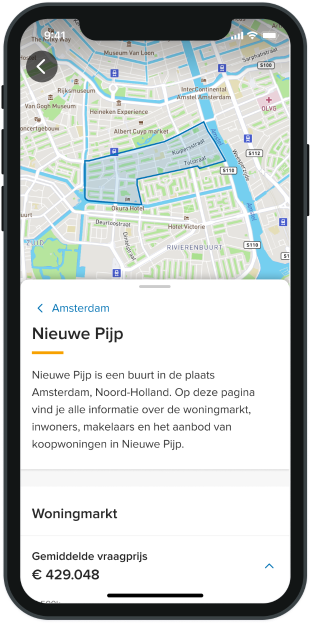
A neighborhood explorer, providing a glimpse into a locations housing market, inhabitants & facilities
Market trends
To get a grasp of the housing market dynamics in an area, we show the average price and time to sell over time.

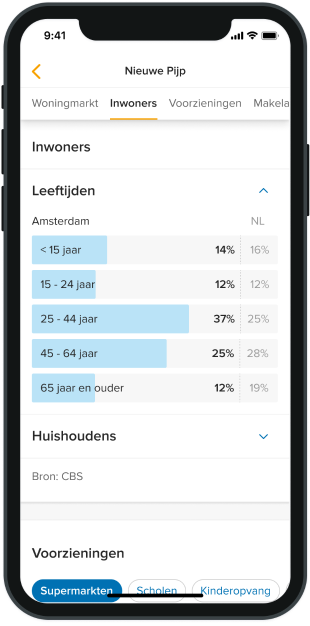
Demographics
To assess if a neighborhood fits your lifestyle, we also show the breakdown of age groups and family situations in an area, gathered from a public source.
Demographics
To assess if a neighborhood fits your lifestyle, we also show the breakdown of age groups and family situations in an area, gathered from a public source.
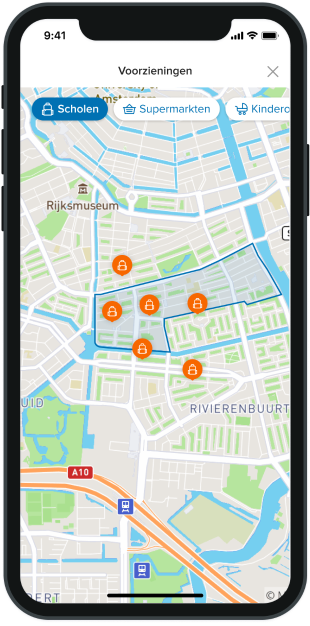
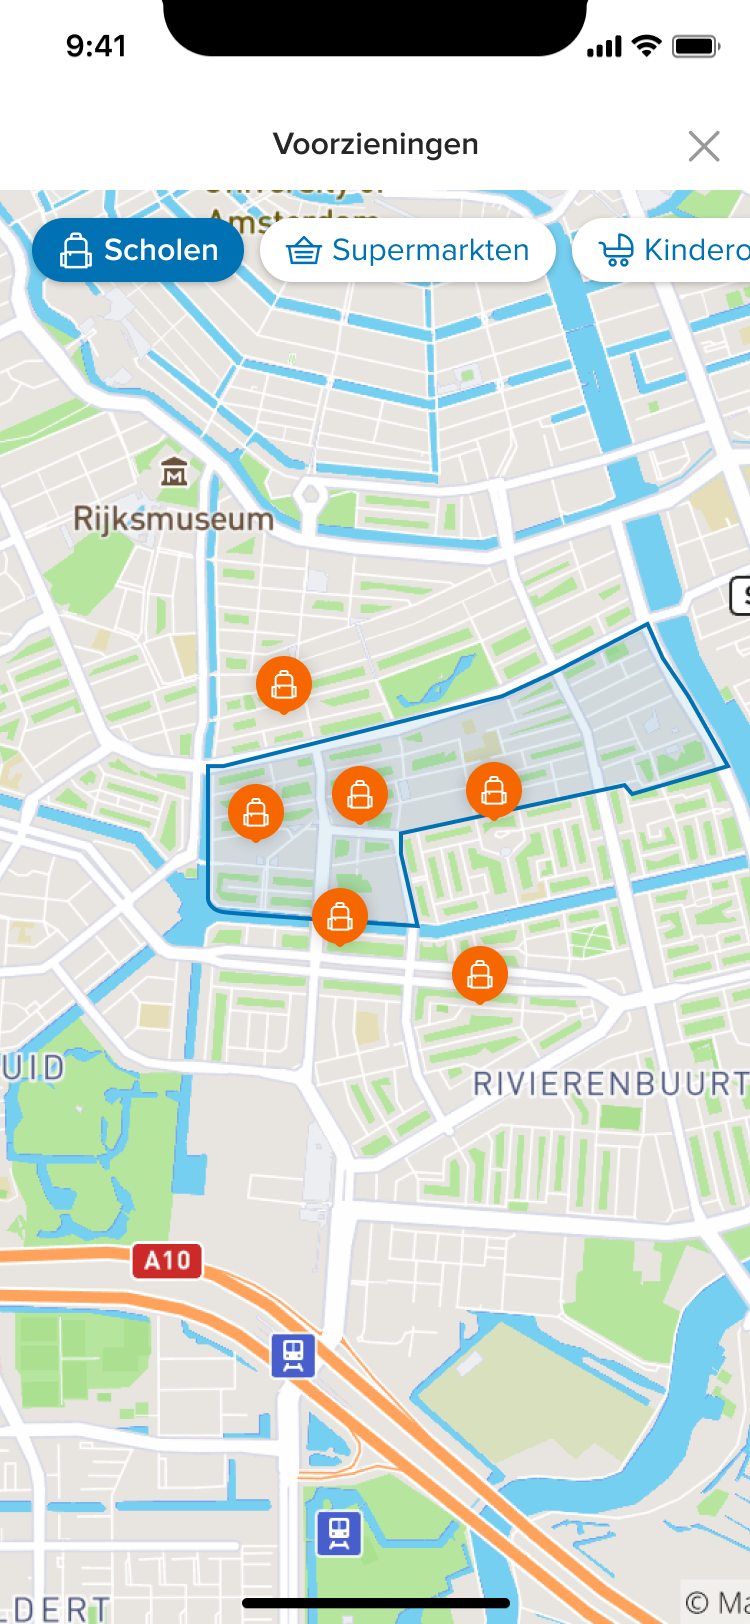
Facilities
The vicinity of facilities, such as supermarkets, daycare centers and public transport, in an area are key for home searchers to decide if they want to live there.
Price history
To get a grasp on how your home value has changed, you can zoom out and look at the price development in the last 12 months.
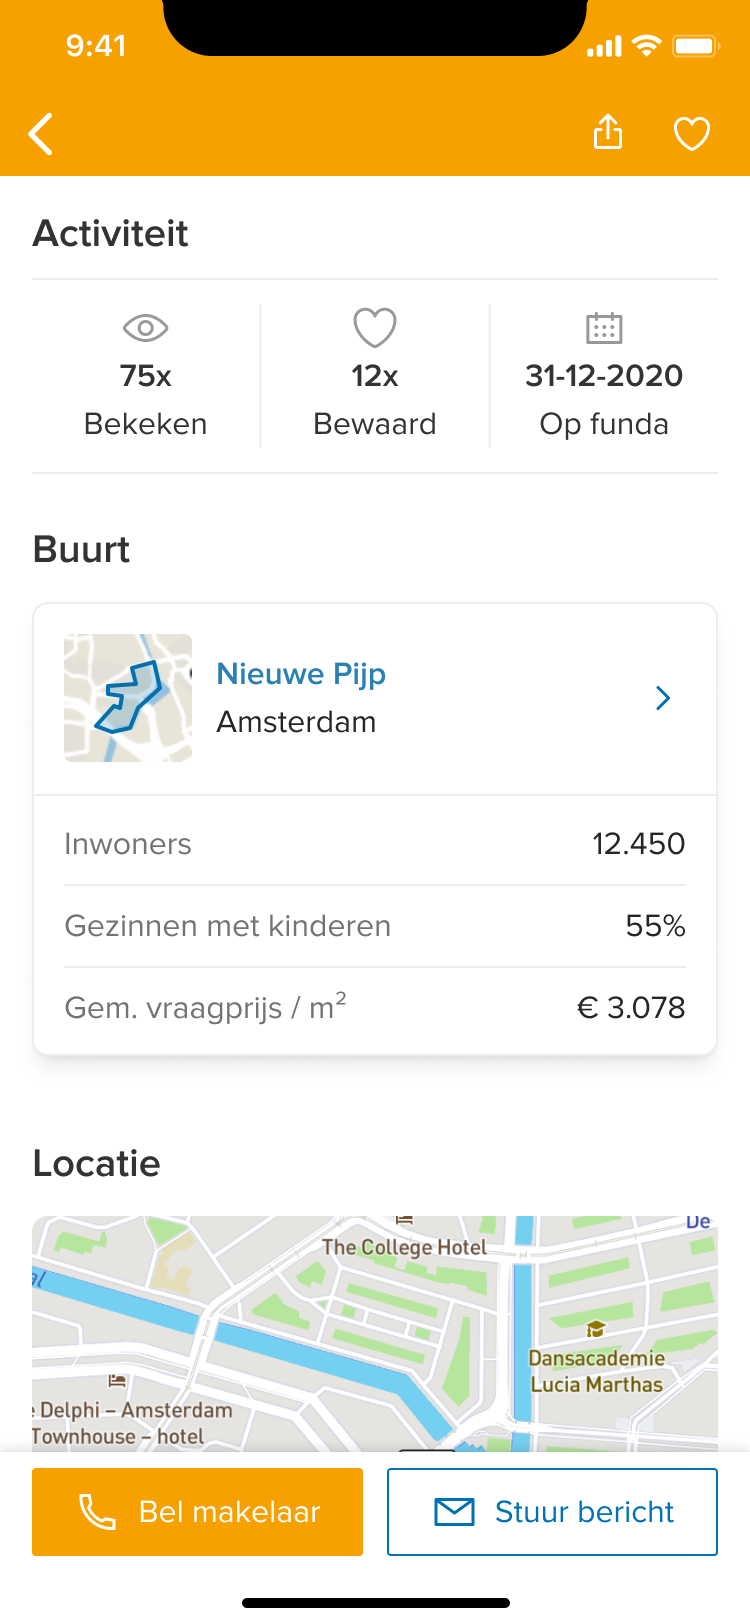
Neighborhood summary
When searchers are looking at homes for sale, we show a summary card, which functions as an entry-point to the detailed view.
Solution
Neighborhood insights
We made the decision to add focus to the feature and simplify the amount and complexity of the data we would show to home-searchers. Through some iterations we reached the current product, which was named ‘neighborhood insights’.
The layout of the neighborhood insights
Mockups of the feature at rollout →
A neighborhood explorer, providing a glimpse into a locations housing market, inhabitants & facilities
Market trends
To get a grasp of the housing market dynamics in an area, we show the average price and time to sell over time.

Demographics
To assess if a neighborhood fits your lifestyle, we also show the breakdown of age groups and family situations in an area, gathered from a public source.
Demographics
To assess if a neighborhood fits your lifestyle, we also show the breakdown of age groups and family situations in an area, gathered from a public source.
Facilities
The vicinity of facilities, such as supermarkets, daycare centers and public transport, in an area are key for home searchers to decide if they want to live there.
Price history
To get a grasp on how your home value has changed, you can zoom out and look at the price development in the last 12 months.
Neighborhood summary
When searchers are looking at homes for sale, we show a summary card, which functions as an entry-point to the detailed view.
Solution
Neighborhood insights
We made the decision to add focus to the feature and simplify the amount and complexity of the data we would show to home-searchers. Through some iterations we reached the current product, which was named ‘neighborhood insights’.
The layout of the neighborhood insights
Mockups of the feature at rollout →
A neighborhood explorer, providing a glimpse into a locations housing market, inhabitants & facilities
Market trends
To get a grasp of the housing market dynamics in an area, we show the average price and time to sell over time.
Demographics
To assess if a neighborhood fits your lifestyle, we also show the breakdown of age groups and family situations in an area, gathered from a public source.
Demographics
To assess if a neighborhood fits your lifestyle, we also show the breakdown of age groups and family situations in an area, gathered from a public source.
Facilities
The vicinity of facilities, such as supermarkets, daycare centers and public transport, in an area are key for home searchers to decide if they want to live there.
Price history
To get a grasp on how your home value has changed, you can zoom out and look at the price development in the last 12 months.
Neighborhood summary
When searchers are looking at homes for sale, we show a summary card, which functions as an entry-point to the detailed view.
Results
The feature was iteratively developed and in the end launched for all neighborhoods and cities in the Netherlands, to give home searchers relevant location insights and context.
unique
pages
22K+
customer
satisfaction
78%
visitors
per MoNTh
400K
Results
The feature was iteratively developed and in the end launched for all neighborhoods and cities in the Netherlands, to give home searchers relevant location insights and context.
unique pages
22K+
customer satisfaction
78%
Estimates per MoNTh
400K
Learnings
Prototypes are a means, not an end
Instead of building lots of complex data-rich detailed design prototypes, we focused on what we wanted to learn in the problem-solution fit phase first. We researched how to get the relevant data in a scaleable way and then explored in which tools we could alter them to make it into a functional prototype. Through this process, we ended up designing a prototype fast and efficiently in Google Data Studio, instead of spending a lot of work in getting the data into actual prototyping tools as Marvell, Figma or Framer.
Ideally, you want to be able to prototype with live data in Figma or Framer of course, but when it’s not readily available, don’t shy away from exploring ‘hacky’ solutions.
Component-driven iterations
We separated all the separate information into separate card-components on the neighborhood pages. This created a clear overview for our users, but also had the benefit of iterating on components separately, improving the insights pages one step at a time, and enriching it in the future.